Allinea DDT

Allinea’s DDT (Distributed Debugging Tool) is a powerful, commercial gui-based debugger used in many HPC environments for debugging large MPI and OpenMP parallel programs. The RCC has purchased licenses for 8 processes for use on Midway. This means a total of 8 processes or MPI ranks can be analyzed at one time, either by one user or multiple users. Threads do not count toward the license limit, so a job using up to 128 cores on Midway can be debugged, provided only one MPI rank is assigned to each 16-core node. To analyze an MPI job with more than 8 ranks, the user must attach DDT to a subset of the MPI ranks.
See the Allinea DDT User Guide for more information.
Usage
DDT can be used to debug a wide variety of programs in a number of different ways, and can be a little complicated to configure. To start ddt, use the command:
$ module load ddt
$ ddt
- This will bring up the DDT wizard to guide you through the various configuration options:
- Run: launch a new program through DDT. This can launch a serial or multithreaded program
on the current node (please use an interactive session), or submit a serial, threaded, or MPI job to Slurm. In the latter case DDT will wait for the job to begin execution and automatically attach itself to the job processes.
- Attach: Attach the DDT debugger to one or more existing processes. If you are running on
a head node, you will need the output of squeue to tell DDT which nodes your processes are running on.
- Core: load the process state from a core file generated by a now terminated process. Useful
for analyzing a program

The online help is very good, and should be the first place you look when things aren’t working.

RCC has configured DDT to work with all supported MPI environments on Midway, and to submit debugging jobs through the batch queues. You may need to alter the default configuration to suit your particular needs. We recommend leaving the MPI implementation option “generic”, as shown below, or “Auto Detect” if you plan to use only one MPI module.

The job submission panel controls how and whether jobs are submitted to the SLURM batch system. If you run DDT from an interactive session, deselect the “submit job through queue” option. Beware, if this is unchecked and you are running DDT on one of the head nodes, your job will run there, not on a compute node.

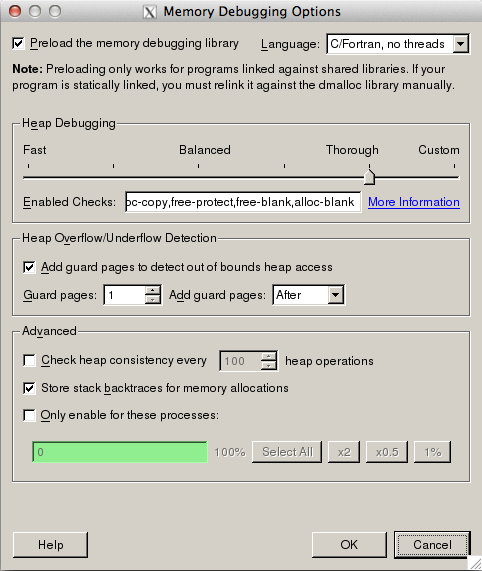
DDT includes a powerful memory checking feature, however it can cause your code to run very slowly due to overhead involved in checking memory accesses and allocations. This memory debugger is not enabled by default, and when enabled can be configured with a variety of checks that affect the resulting overhead. Select “Memory Debugging” details from the job submission window to bring up the full set of options. Be sure to select the language “C/Fortran, threads” when debugging a multi-threaded program or “no threads” when debugging serially.
The following sections describe the steps necessary to configure DDT in its various modes.
Interactive
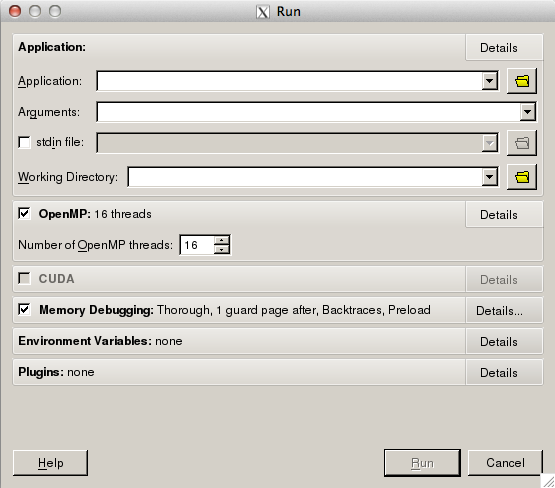
When running DDT from a compute node interactive session, be sure to deselect the checkbox on the Options panel, “Job Submission” section. DDT will then execute the program to debug on the current machine. The job run window will look like the following. Configure the job options including arguments and working directory, OpenMP threading, and Memory Debugging.
DDT batch submission
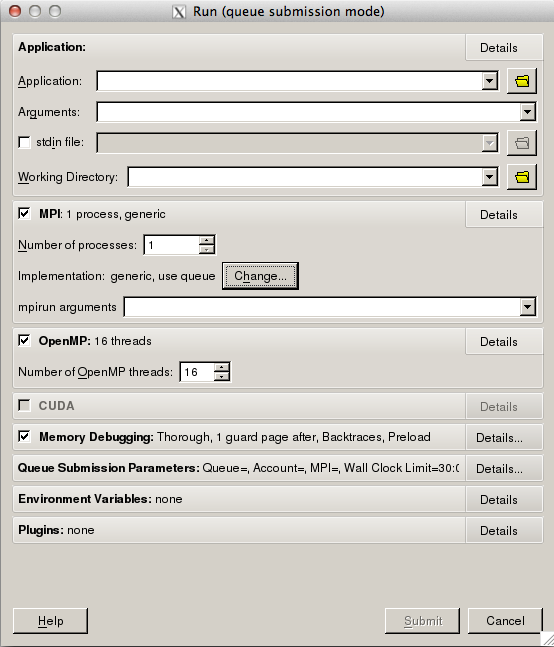
When running MPI jobs on more than one node it is necessary to have DDT submit your job to the batch scheduler (this is also possible for OpenMP or serial codes, however in that case an interactive session will be easier). The run window is very similar to the interactive case, with the ability to alter Queue Submission Parameters.
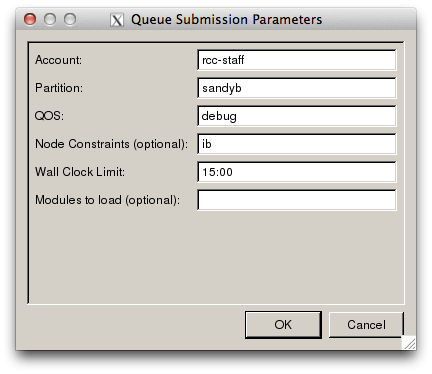
When you select Submit, DDT will bring up the Queue Submission Parameters, which allows
you to configure SLURM options based on the following submission template script. If you
need to further configure your job script, you can create your own template and use the
option in the Job Submission options panel to point DDT there. Instructions on how to
customize these templates can be found in the Allinea DDT User Guide, or in the sample script at /software/allinea/tools/templates/sample.qtf.
#!/bin/bash

# ACCOUNT_TAG: {type=text,label="Account"}
# PARTITION_TAG: {type=text,label="Partition",default="sandyb"}
# QOS_TAG: {type=text,label="QOS",default="debug"}
# CONSTRAINT_TAG: {type=text,label="Node Constraints (optional)",default="ib"}
# WALL_CLOCK_LIMIT_TAG: {type=text,label="Wall Clock Limit",default="15:00",mask="09:09"}
# MODULES_TAG: {type=text,label="Modules to load (optional)"}

#SBATCH --partition=PARTITION_TAG
#SBATCH --account=ACCOUNT_TAG
#SBATCH --qos=QOS_TAG

#SBATCH --nodes=NUM_NODES_TAG
#SBATCH --constraint=CONSTRAINT_TAG

#SBATCH --ntasks-per-node=PROCS_PER_NODE_TAG
#SBATCH --cpus-per-task=NUM_THREADS_TAG
#SBATCH --time=WALL_CLOCK_LIMIT_TAG
#SBATCH --output=PROGRAM_TAG-ddt-%j.out

#SBATCH --no-requeue
#SBATCH --exclusive

module load MODULES_TAG

AUTO_LAUNCH_TAG
The default template has mandatory fields for walltime, partition, account, and qos. Constraint and modules fields allow you to request nodes with a gpu or load necessary modules (although DDT will export your current environment, so this should not be necessary in general).
Note
The maximum wallclock time for the debug qos is 15 minutes. DDT will resubmit your job to the queue as necessary, or you can select the normal qos for a longer walltime. You may request a Slurm reservation from RCC staff to ensure that nodes are available.
DDT will continually refresh the output of squeue and wait until your job has started. Be sure that you have selected options that will allow your job to eventually start.

Once the job has started and DDT has attached to all running processes you will be taken to the normal debug window for the number of MPI ranks and threads you chose. Some MPI implementations will include threads used by the MPI implementation, which can be safely ignored.
Attach to running process
In order to attach to a running process you will need to know the node(s) and PID(s) of the processes you wish to examine. The slurm command squeue can be used for the former, and the system call getpid or ps can be used for the latter. DDT can be run directly on the node your
The following c code will insert a breakpoint for all processes in an MPI program, allowing you to attach to the correct process and continue from the specified point in the code:
void mpi_breakpoint( int proc ) {
    int rank, i = 0;
    char host[256];
    MPI_Comm_rank( MPI_COMM_WORLD, &rank );
    if ( rank == proc ) {
        gethostname(host,256);
        printf("%u entering breakpoint from host %s, %s:%u\n",
            getpid(), host, __FILE__, __LINE__+1 );
        while ( i == 0 ) {
            sleep(1);
        }
     }
     MPI_Barrier( MPI_COMM_WORLD );
 }
Generally the attached process will be inside the sleep system call. Set a breakpoint at the specified line or MPI_Barrier, then set the value of the variable i to a non-zero value to allow the process to proceed.
Once the code has returned from the mpi_breakpoint function (after the barrier), you can debug that process normally. Other processes will proceed as normally, only waiting on blocking communication with the attached process(es).


